Phew! An exciting day indeed, so I’ll jot down a few notes to recap what happened.
The BICEP2/Keck experiments detected B-modes at large angular scales in the polarisation of the CMB. They released two papers and some data online just as the announcement was made, which you can find here. Not all of the data mind, but it’s plenty to go on for now.
Their interpretation of the data is that they detect a bump at low-ell that is characteristic of primordial B-modes generated by inflation. If true, this is super exciting, as it gives us a (sort of, but not really) direct detection of gravitational waves, and opens up a new window on the very early Universe (and hence extremely high energy scales). People are even saying it’s a probe of quantum gravity, which I guess is sort of true. Furthermore, they find a best-fit value of the scalar-tensor ratio of r = 0.20 +0.07/-0.05, which is a significantly higher value than many inflationary theorists would have expected, but which counts as a very firm detection of r. This will surely shake-up the inflation people in coming months.
Null tests
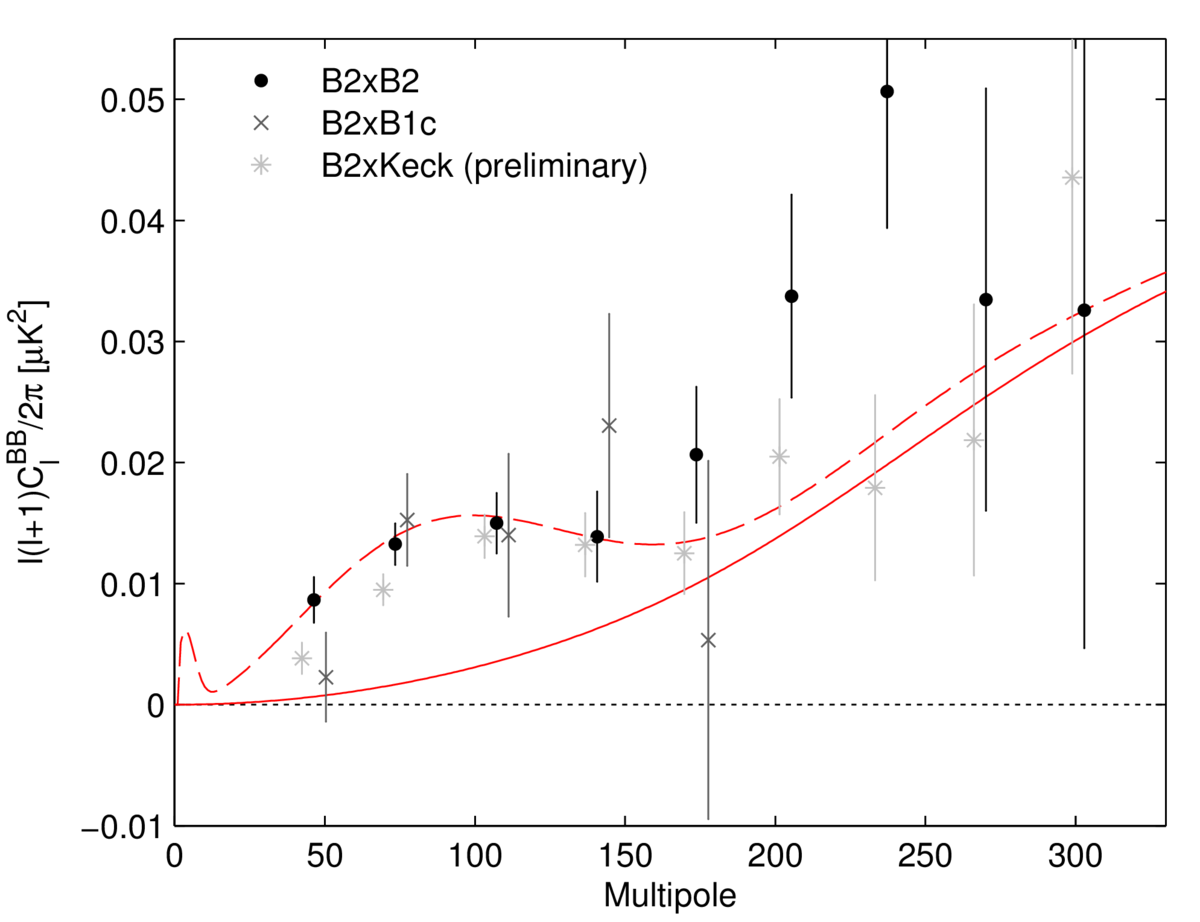
There do appear to be some issues with the data – as there always are for any experiment – but it’s not clear how important they are. In particular, Hans Kristian Eriksen points out that their null tests look a bit fishy at first glance. Check out the blue points in the plot to the right. These are the null test for the BB power spectrum, which you’d expect to be consistent with zero if everything is hunky dory. And they are! The problem is that they look too consistent – absolutely all of the errorbars overlap with zero. You’d naively expect about a third of the points to have their errorbars not overlapping with zero, since they represent a 68% confidence level – on average, 32% of samples should lie more than one errorbar away. This isn’t the case.

What does this mean? Well, maybe they don’t have a perfect handle on their noise levels. If they overestimate the noise, the errorbars are larger than they should be, and the null tests look more consistent than they really are. This could hide Bad Things, like systematics. (I’m certainly not saying they purposefully inflated their errorbars, by the way; just that something doesn’t quite add up with them. This happens very commonly in cosmology.) But hey, maybe this is a relatively minor issue.
You also see this in Table I of the results paper [pdf], where they quote the results of their “jackknife” tests. The idea behind jackknife tests is explained reasonably well here (Section 7) – you cut up your data into two roughly equal halves that should have the same signal, but might be subject to different systematics, and check to see if they’re statistically consistent with one another. If not, you’ve identified a systematic that you need to deal with.
The consistency test normally involves subtracting one sub-set from the other, and checking if the result significantly differs from zero. For example, you might imagine splitting the data depending on what time of year it was taken: Spring/Summer vs. Autumn/Winter, for example. If the two are inconsistent, then you’re seeing some sort of seasonal variation, which is most likely a systematic that you didn’t account for rather than a real time-dependence in your data…
Anyway, Table I quotes the results of a whole battery of jackknife tests. Great. But things are still a bit fishy. Why do three of the tests have a probability to exceed (PTE) of 0.000, for example? (Up to rounding error, this actually means p < 0.0005). What are the odds of that happening? PTE’s should be uniform distributed. For the 14 x 12 jackknife tests that have been used, the odds of getting three results drawn from Uniform with p < 0.0005 is a bit slim – you could maybe get away with one, but not three. So there’s maybe some inconsistency here. It could be the data, it could be to do with the simulations they’ve used to calculate the PTE’s, I don’t know. Or maybe I’ve missed something. But the problem gets worse if you think the errorbars are overestimated; shrinking the errorbars will shrink the width of the simulated distribution, and the observed value will look less and less consistent – the PTE’s will fall across the board.
[Update: Christopher Sheehy comments below that the three null test failures were apparently just typos. The BICEP2 team have updated the paper on arXiv, and now there’s only one PTE < 0.0005 in the table.]
(Quick note: the PTE, as I understand it in this context, is the probability that a value drawn from their simulations will be greater than the observed value. So a PTE of 0.9 means that there’s a 90% chance a randomly-chosen simulated value will be greater than the observed value, which would be good here – it means the observed value is well within what they expect from simulations, so it would be consistent with no systematic effect being present. Low PTE’s are bad, since it means the observed value is less consistent with your expectations. You should normally expect to see some low PTE’s, however, and the number of very low PTE’s that can be tolerated depends on how many tests you did. More tests means you expect more low PTE’s.)
Excess/additive systematics
So that’s the blue points in the plot above. Now on to the black points and red/green lines. If you squint a bit, and ignore the dashed red lines, you can convince yourself that a straight line would fit the points quite well (green line; my addition). The point is that BICEP2 don’t clearly see the bump feature (the “smoking gun” of the inflationary B-modes) in their data; they just see an excess amplitude at low ell. Could something else cause this excess?

Imagine if there were no primordial B-modes, and you only had the lensing spectrum, which is the solid red line. If the lensing amplitude was increased, could you make it fit? Probably not; the lensing spectrum drops off too quickly at low-ell, so it would be difficult to capture the first two data points while staying consistent with everything at higher ell just by changing the amplitude. The BICEP2 team have tried this trick, in fact (see the plot on the right), and even allowing the lensing amplitude to vary by quite a large factor isn’t enough to explain the low ell power. So it still looks like a detection of non-zero r.
There’s also the issue of an excess at higher ell in the BICEP2-only results, as shown in the first plot, above (it seems to go away in the BICEP2 x Keck preliminary results). You could maybe imagine an additive systematic in the BB power spectrum that shifts a lensing-only BB spectrum upwards (roughly the green line). This would fit the data quite well, without any primordial contribution, although whether such an additive systematic is plausible or not I don’t know.
Other non-inflation stuff (primordial magnetic fields or some such, who knows) might explain the low-ell power too. All I’m saying here is that while the primordial B-mode seems to fit extremely well, the unique “bump” shape isn’t clearly detected, so maybe there are other explanations too. We’ll need to wait and see if anything else works.
Foregrounds
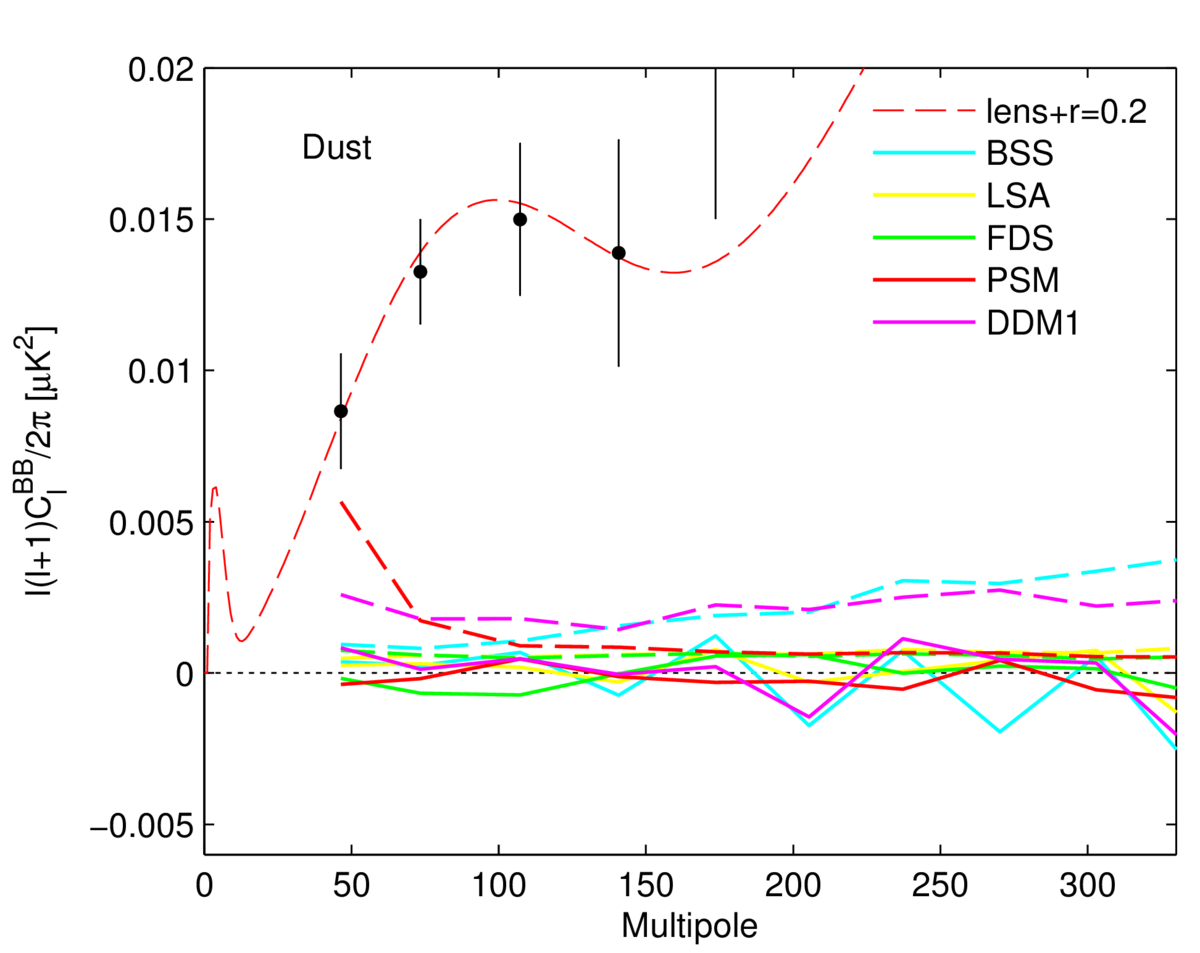
I’ve heard some minor grumbling about foreground subtraction, which I’ll only mention briefly. Polarised galactic dust seems to be the main worry, and they’re arguably not using the most fantastically realistic dust maps, although as they correctly point out it will probably have to wait until the next Planck release until something better is available. Their Fig. 6 shows the contribution to the polarisation that they’d expect from a bunch of foreground models, all of which are dwarfed by the detected signal. The implication is that foregrounds aren’t a major issue, but of course this statement is only as good as the models. Maybe Planck will see more polarised emission at the BICEP2 pointing than expected? We’ll have to wait and see, although it seems like a bit of a stretch to flag this up as a major concern.
Also, if I’m interpreting their paper correctly, it seems that they just subtract off the foreground templates with fixed amplitude, rather than fitting the amplitude (and propagating through the errors associated with doing this). Hey, this is what Commander is for. But I doubt that accounting for this would blow up their errorbars too much. Foreground subtraction does shift their best-fit value of r down to more like r=0.16, though, which is slightly less jarring than a full r=0.2. It doesn’t get rid of the detection, though.
[Edit: Clive Dickinson left an insightful comment on the foreground issue below.]
Overall picture
The overall picture is that this is a serious result, which looks pretty good, but isn’t entirely free of holes. My gut feeling is that the claimed detection significance, and best-fit value of r, will go down with further analysis. I’d be surprised to see the detection go away entirely, though, unless they found a whopping systematic. We’ll have a better idea what’s going on when the Keck analysis has been completed and, after that, when the Planck polarisation data is released towards the end of the year.
So all I can say is, congratulations BICEP2!
(Thanks to Hans Kristian Eriksen and Yashar Akrami for useful discussions over the course of the day. Any errors in the above are my own, of course.)

March 17th, 2014 at 11:19 pm
[…] have given their (more technical) opinions and interpretations online: Peter Coles at Sussex, Phil Bull in Oslo, and I’ll add a few more as I find […]
March 18th, 2014 at 12:47 am
Excellent analysis.
Forty years ago, anything before Big Bang was not allowed. But logically, nothing should come out of the blue, including the Big Bang. So, here came with the idea of inflation, excellent. In addition to just being an idea, now there is a set of data hinting (still not solid per your analysis, and I agree with you 100%) that reality. But, the issue cannot stop here, that is, the inflation could not come out of blue neither. Thus, logically, inflation must be the cumulative result of the cyclic universes before ‘this’ Big Bang. Therefore, even if this data is not 100% accurate, there must have something before this Big Bang. This is my opinion.
March 18th, 2014 at 8:44 am
Well, it depends on what you mean by “before the Big Bang”. This result actually seems to rule out a bunch of the most plausible cyclic universe models.
March 18th, 2014 at 1:44 am
[…] MEZ. NACHTRÄGE: jede Menge Artikel hier, hier, hier, hier, hier, hier, hier, hier, hier, hier, hier, hier, hier, hier, hier, hier, hier, hier, hier, hier, hier, hier, hier und […]
March 18th, 2014 at 11:47 am
Reblogged this on In the Dark and commented:
Another wordpress post about BICEP2 – with some comments on possible issues with the data…
March 18th, 2014 at 12:05 pm
i’m sorry that i repeat my post from another blog (because poor eng) … this is, now what i write may seem pure folly and so ask for forgiveness and a great understanding for my stupidity. i can not understand everything yet but i would not rush with nobel. we have rather doubtful evidence to even more doubtful theory. predicted, even proved, so we can fully see its importance in our attempt to understand the universe. a little problem only is… inflation itself has no deeper meaning. but perhaps i’m wrong. so once again please forgive me!
March 18th, 2014 at 3:53 pm
yeah, I’m disappointed in the foregrounds analysis. There needs to be much more discussion for such an important detection. There are a number of issues here. I wot go into all of them. But perhaps the most relevant is the dust model used. They use a number of models but they are all based on large-scale magnetic fields. The small scale power is close to random, which means there will be no correlation with the real data. This includes the Planck Sky Model (PSM) which currently does not use real Planck polarisation data (it will eventually, when Planck pol data are released). Bottom line is that there is some potential for foregrounds to reduce the power in BB by quite a lot. Maybe not enough to remove it all together, but it may well bring it back in line with previous upper limits i.e. r~0.1. We are looking into this…
Clive Dickinson
March 19th, 2014 at 3:33 am
Hi, in regard to the three apparent jackknife failures, let me quote Denis Barkats in response to David Spergel. “David, regarding the 0.000 in the table, this was an error in the version that was uploaded to the Arxiv. It contained a very old version of the PTE table which used much lower Monte Carlo statistics. An updated version is going up today with the correct table.”
There is really only one 0.000 jackknife PTE, which we acknowledge and discuss in the text. Very very sorry for the noise.
March 19th, 2014 at 10:15 am
Excellent, thanks Christopher. I’ll add a note.
March 19th, 2014 at 9:33 am
Nice blog. Even if none of the above was in any way “fishy”, how solid is any claim based on inference? Let’s say there’s no issue with the B-mode polarization of the CMB, and that other experiments confirm it. But the CMB dates from the epoch of recombination, not the inflationary epoch. It’s 378,000 years versus 10ˉ³² seconds. IMHO you just can’t use this result to prove Guth-style inflation.
March 19th, 2014 at 10:14 am
Even if you see something with your own eyes, there’s still some amount of inference involved in interpreting what you’re looking at… I don’t see why the separation in time should matter; if you have some physical laws that you’re confident in (and which are continually being vindicated by experiment), and they give you this prediction, and then, lo and behold, you see exactly what they predict… There’s clearly something in it.
March 19th, 2014 at 12:34 pm
In view of the fact that there are plausible theoretical frameworks, (such as large volume compact extra dimensions, with fundamental Planck scale in the range from say 10 TeV to 100 TeV), that are consistent with observation apart from BICEP2, and suggest a value of r far too small for BICEP2 to detect, would it be unreasonable to interpret the BICEP2 result not as a measurement of r, but rather, as a measurement, with unprecedented accuracy, of the possibly significant foregrounds hinted at by Clive Dickinson above?
March 19th, 2014 at 2:50 pm
So this is really a question of how seriously you take your theoretical priors — do you believe your theories are more likely to be right than the obvious interpretation of the data? When it comes to the early Universe, there’s such a preponderance of mutually contradictory theories that I think it’s safe to say that no-one knows (yet) what really went on. So I don’t think you can prefer the foreground explanation over the gravitational wave explanation based on the plausibility of various theories alone. We’ll have to wait and see what more data tell us.
March 20th, 2014 at 2:02 pm
[…] i sina mätningar: läs Jostein Riiser Kristiansens summering på norska och Phil Bulls kommentarer på engelska. Och från England ser kosmologen Peter Coles flera tecken på saker kan vara […]
March 20th, 2014 at 5:50 pm
Did everyone forget that just a couple of years ago, IBEX detected very strong evidence for unmodeled *galactic* magnetic fields? I guess so. Reminder: http://www.dailygalaxy.com/my_weblog/2014/02/-vast-galactic-magnetic-field-extends-far-beyond-our-solar-system.html
March 23rd, 2014 at 3:53 am
[…] How solid is the BICEP2 B-mode result? | Lumps ‘n’ Bumps […]
March 23rd, 2014 at 10:46 pm
[…] Kurve liegen, deren Richtigkeit BICEP2 behauptet (David Spergel hier, Peter Coles hier, Phil Bull hier, Antony Lewis […]
March 25th, 2014 at 7:24 pm
Hi Phil, nice blog post.
I’m not convinced by Eriksen’s argument about the jackknife plot (which is not affected by the table update). I agree that if you look at one plot its unlikely to find all jackknife points so close to zero, that’s what the 0.99 PTE is telling us. But over 168 jackknife tests (as in the table) the likelihood that one of them has a PTE as large 0.99 is pretty high! There aren’t any in the table that have a PTE larger than 0.99, it’s just a matter of luck I think that they chose to plot that particular one. So I don’t see any justification for concluding that the error bars are too large.
March 27th, 2014 at 10:40 am
I agree that you can’t *absolutely* conclude that the errorbars are too large, for the reasons you stated. But it’s more a matter of seeing hints of issues that need to be followed-up. I mean, it’s pretty bad luck that they just happened to plot the one jackknife test that made their errorbars look too big, right? So of course it *could* just be a statistical fluke… or it could be an error estimation issue, as Hans Kristian suggested.
Experience shows that, more often than not with these things, it’ll be the errorbars that are to blame. That’s not enough to *conclude* that that’s what’s going on in this case, but it’s strong enough motivation to give their error estimation more scrutiny.
March 27th, 2014 at 9:26 am
Hi Phil – I left a comment here the other day but it doesn’t seem to have appeared. Perhaps still awaiting moderation?
March 27th, 2014 at 10:28 am
Sorry, busy week! I’ve cleared the comment backlog now.
March 27th, 2014 at 5:59 pm
Would not acoustic effect look similar to gravity effects??
Why did the gravity waves not die out After 370000 years??
And how strong were they at 1 sec?
Is Planck capable of measuring the same r and at more frequencies?
Just wondering g
March 27th, 2014 at 10:41 pm
Lots of the fundamentals of B-mode physics are covered on Wayne Hu’s website, so I’ll point you to that for now. Planck should be able to see r=0.2 (and it covers more frequencies, which is important for removing the foreground contamination), but it’s sensitive to different angular scales, so might not be able to exactly confirm the BICEP2 measurement.
March 28th, 2014 at 3:40 am
Thanks. I will check out that web site.
I hope the data is confirmed. But it looks like there is a second bump in the b data.
Perhaps with further observations it will be co firmed like the ams on the space lab did.
July 3rd, 2014 at 3:27 am
[…] https://philbull.wordpress.com/2014/03/17/how-solid-is-the-bicep2-b-mode-result/, 17 March 2014. […]
September 3rd, 2014 at 10:03 pm
[…] March of this year, immediately following the jubilation surrounding the BICEP2 results, the Daily Mail published a bizarre opinion piece on two scientists that were interviewed about the […]
February 15th, 2015 at 9:46 pm
[…] Allerdings, wie gesagt: Was man zu der entsprechenden Zeit zwar nicht in diesem Artikel, aber eben in Wissenschaftsblogs und auf Facebook lesen konnte, waren die möglichen Schwachstellen, inklusive der […]
February 23rd, 2020 at 11:37 am
[…] blogs with discussions of this result include Lumps’n’Bumps and Of Particular […]