Phew! An exciting day indeed, so I’ll jot down a few notes to recap what happened.
The BICEP2/Keck experiments detected B-modes at large angular scales in the polarisation of the CMB. They released two papers and some data online just as the announcement was made, which you can find here. Not all of the data mind, but it’s plenty to go on for now.
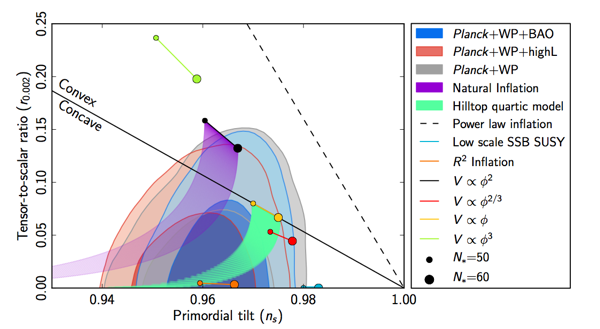
Their interpretation of the data is that they detect a bump at low-ell that is characteristic of primordial B-modes generated by inflation. If true, this is super exciting, as it gives us a (sort of, but not really) direct detection of gravitational waves, and opens up a new window on the very early Universe (and hence extremely high energy scales). People are even saying it’s a probe of quantum gravity, which I guess is sort of true. Furthermore, they find a best-fit value of the scalar-tensor ratio of r = 0.20 +0.07/-0.05, which is a significantly higher value than many inflationary theorists would have expected, but which counts as a very firm detection of r. This will surely shake-up the inflation people in coming months.
Null tests
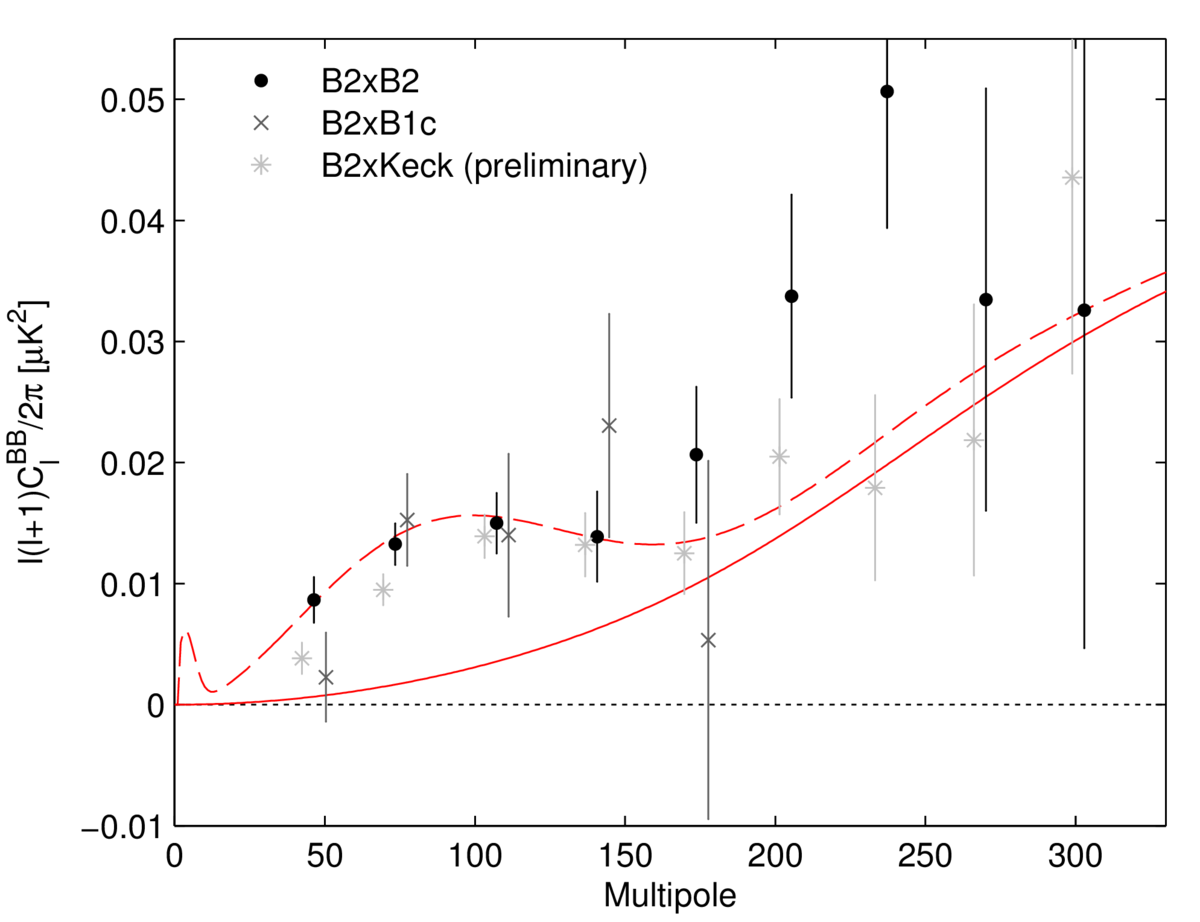
There do appear to be some issues with the data – as there always are for any experiment – but it’s not clear how important they are. In particular, Hans Kristian Eriksen points out that their null tests look a bit fishy at first glance. Check out the blue points in the plot to the right. These are the null test for the BB power spectrum, which you’d expect to be consistent with zero if everything is hunky dory. And they are! The problem is that they look too consistent – absolutely all of the errorbars overlap with zero. You’d naively expect about a third of the points to have their errorbars not overlapping with zero, since they represent a 68% confidence level – on average, 32% of samples should lie more than one errorbar away. This isn’t the case.

What does this mean? Well, maybe they don’t have a perfect handle on their noise levels. If they overestimate the noise, the errorbars are larger than they should be, and the null tests look more consistent than they really are. This could hide Bad Things, like systematics. (I’m certainly not saying they purposefully inflated their errorbars, by the way; just that something doesn’t quite add up with them. This happens very commonly in cosmology.) But hey, maybe this is a relatively minor issue.
You also see this in Table I of the results paper [pdf], where they quote the results of their “jackknife” tests. The idea behind jackknife tests is explained reasonably well here (Section 7) – you cut up your data into two roughly equal halves that should have the same signal, but might be subject to different systematics, and check to see if they’re statistically consistent with one another. If not, you’ve identified a systematic that you need to deal with.
The consistency test normally involves subtracting one sub-set from the other, and checking if the result significantly differs from zero. For example, you might imagine splitting the data depending on what time of year it was taken: Spring/Summer vs. Autumn/Winter, for example. If the two are inconsistent, then you’re seeing some sort of seasonal variation, which is most likely a systematic that you didn’t account for rather than a real time-dependence in your data…
Anyway, Table I quotes the results of a whole battery of jackknife tests. Great. But things are still a bit fishy. Why do three of the tests have a probability to exceed (PTE) of 0.000, for example? (Up to rounding error, this actually means p < 0.0005). What are the odds of that happening? PTE’s should be uniform distributed. For the 14 x 12 jackknife tests that have been used, the odds of getting three results drawn from Uniform with p < 0.0005 is a bit slim – you could maybe get away with one, but not three. So there’s maybe some inconsistency here. It could be the data, it could be to do with the simulations they’ve used to calculate the PTE’s, I don’t know. Or maybe I’ve missed something. But the problem gets worse if you think the errorbars are overestimated; shrinking the errorbars will shrink the width of the simulated distribution, and the observed value will look less and less consistent – the PTE’s will fall across the board.
[Update: Christopher Sheehy comments below that the three null test failures were apparently just typos. The BICEP2 team have updated the paper on arXiv, and now there’s only one PTE < 0.0005 in the table.]
(Quick note: the PTE, as I understand it in this context, is the probability that a value drawn from their simulations will be greater than the observed value. So a PTE of 0.9 means that there’s a 90% chance a randomly-chosen simulated value will be greater than the observed value, which would be good here – it means the observed value is well within what they expect from simulations, so it would be consistent with no systematic effect being present. Low PTE’s are bad, since it means the observed value is less consistent with your expectations. You should normally expect to see some low PTE’s, however, and the number of very low PTE’s that can be tolerated depends on how many tests you did. More tests means you expect more low PTE’s.)
Excess/additive systematics
So that’s the blue points in the plot above. Now on to the black points and red/green lines. If you squint a bit, and ignore the dashed red lines, you can convince yourself that a straight line would fit the points quite well (green line; my addition). The point is that BICEP2 don’t clearly see the bump feature (the “smoking gun” of the inflationary B-modes) in their data; they just see an excess amplitude at low ell. Could something else cause this excess?

Imagine if there were no primordial B-modes, and you only had the lensing spectrum, which is the solid red line. If the lensing amplitude was increased, could you make it fit? Probably not; the lensing spectrum drops off too quickly at low-ell, so it would be difficult to capture the first two data points while staying consistent with everything at higher ell just by changing the amplitude. The BICEP2 team have tried this trick, in fact (see the plot on the right), and even allowing the lensing amplitude to vary by quite a large factor isn’t enough to explain the low ell power. So it still looks like a detection of non-zero r.
There’s also the issue of an excess at higher ell in the BICEP2-only results, as shown in the first plot, above (it seems to go away in the BICEP2 x Keck preliminary results). You could maybe imagine an additive systematic in the BB power spectrum that shifts a lensing-only BB spectrum upwards (roughly the green line). This would fit the data quite well, without any primordial contribution, although whether such an additive systematic is plausible or not I don’t know.
Other non-inflation stuff (primordial magnetic fields or some such, who knows) might explain the low-ell power too. All I’m saying here is that while the primordial B-mode seems to fit extremely well, the unique “bump” shape isn’t clearly detected, so maybe there are other explanations too. We’ll need to wait and see if anything else works.
Foregrounds
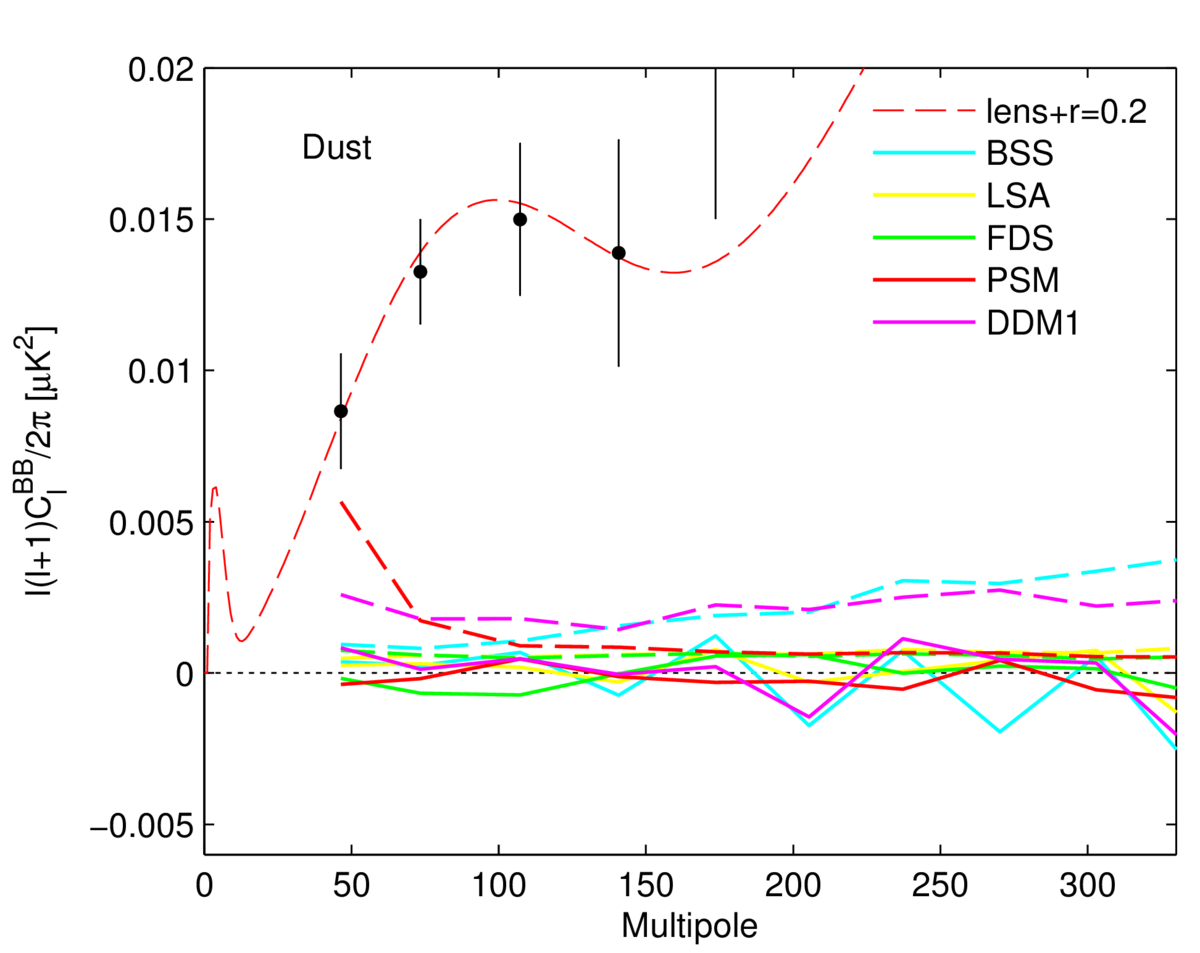
I’ve heard some minor grumbling about foreground subtraction, which I’ll only mention briefly. Polarised galactic dust seems to be the main worry, and they’re arguably not using the most fantastically realistic dust maps, although as they correctly point out it will probably have to wait until the next Planck release until something better is available. Their Fig. 6 shows the contribution to the polarisation that they’d expect from a bunch of foreground models, all of which are dwarfed by the detected signal. The implication is that foregrounds aren’t a major issue, but of course this statement is only as good as the models. Maybe Planck will see more polarised emission at the BICEP2 pointing than expected? We’ll have to wait and see, although it seems like a bit of a stretch to flag this up as a major concern.
Also, if I’m interpreting their paper correctly, it seems that they just subtract off the foreground templates with fixed amplitude, rather than fitting the amplitude (and propagating through the errors associated with doing this). Hey, this is what Commander is for. But I doubt that accounting for this would blow up their errorbars too much. Foreground subtraction does shift their best-fit value of r down to more like r=0.16, though, which is slightly less jarring than a full r=0.2. It doesn’t get rid of the detection, though.
[Edit: Clive Dickinson left an insightful comment on the foreground issue below.]
Overall picture
The overall picture is that this is a serious result, which looks pretty good, but isn’t entirely free of holes. My gut feeling is that the claimed detection significance, and best-fit value of r, will go down with further analysis. I’d be surprised to see the detection go away entirely, though, unless they found a whopping systematic. We’ll have a better idea what’s going on when the Keck analysis has been completed and, after that, when the Planck polarisation data is released towards the end of the year.
So all I can say is, congratulations BICEP2!
(Thanks to Hans Kristian Eriksen and Yashar Akrami for useful discussions over the course of the day. Any errors in the above are my own, of course.)

